| VariPlant®
Control: Precision Agriculture Means Varying Rate Seeding & Other Inputs |
|---|

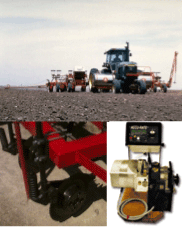
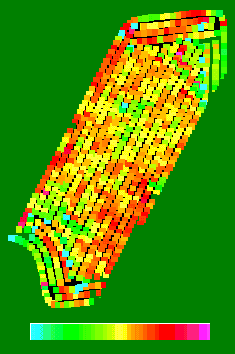
The field above was planted with the Soil Doctor® VariPlant® Control. The Soil Doctor® System's VariPlant® Control uses CTI's patented on-the-go CEC soil sensor, in conjunction with Rawson's AccuPlant hydraulic control to achieve the variable plant population shown above.

With CEC Soil Sensing integrated into tractor-based applicators,
growers can automate the Variable Rate Input of almost anything
imaginable: Variable Rate Anhydrous Application (Fall or Spring
pre-plant), Variable Rate Starter, Variable Rate Spraying of
Herbicides, Variable Rate Application of Dry Fertilizer, as well
as Variable Rate
Planting/Seeding.

These Maps are brought to you Courtesy of Jan
and George Holsapple of Jewett, Illinois,
For they, not CTI, Own the Data.
The Holsapples varied their plant population, starter application, and sidedress application, foot-to-foot, with their Soil Doctor® System, the most Complete Precision Farming System in the World!
For 1996 Data recorded by Mr. Holsapple and other Soil Doctor® owners.
 Population 100% = 25,000/acre
* Both the red spot area to the lower left and
the red, two section, long area to the right of center are High
productivity areas, known by the producer from field experience
with prior corn crops. These areas were confirmed by the producer
on the screen of his Field Manager (cab unit) VariPlant display
during planting.
The North East area is the outflow of richer soil from an
adjoining field. (One farmer's loss can be another's gain.) This
is one example of the value of post-planting data review.
Remember, however, that the producer already knew the field and
already knew the reason for the more productive areas.
Neither a GPS/DGPS nor GIS (Nor their time consuming use) are
required to variably and simultaneously control plant population
and starter fertilizer rates.
* The long blue area (South to North) to the right is the
Producer's test strip for constant plant population (100%) in
this field. Note also that under the producer's guidelines that
only a portion of the field was planted at his previous year's
normal (100%) population.
The remainder of the field was planted at variable rate for both
population and starter fertilizer.
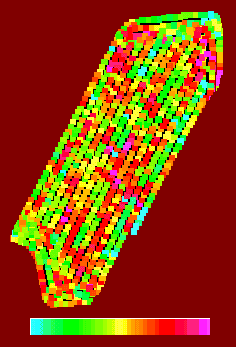
Refer to the CEC map below. The round planted at constant
population was chosen in a low CEC area of the field (South end).
{Note that the maximum sampling rate of the Soil Doctor system
using production software is 7,250 samples per acre. A smaller
sample size was selected due to the GPS/DGPS sampling limitation
of one sample per second.}
This CEC map is based on 10,201 samples collected On-the-Go in relatively flat terrain. For comparison, this field was first divided into 12 grid areas (about 5 acres/sample), but the manual samplers were not provided this detailed map before grid-sampling. The average CEC determined by laboratory analysis was 7.6, which -- on "average" is what the high intensity data above describes. But manual grid sampling misses all of the detail in the field. The highest manual soil sample value was collected in the southwest quadrant. The samplers appear to have missed the productive area in the northeast and sampled to the east of the most productive area.
Explore the benefits of Soil Doctor TrueVue data recording and high resolution field definition for yourself. See Grid Sampling Study
Additional Hybrid/seeding rate/yield
performance experimentation was conducted on the Holsapple Farm (Clane soil)
by Asgrow during 1996.
Hybrid/Stand/Yield data is summarized at the Asgrow Data Chart. All replicated test plots were
sidedressed with the Soil Doctor® VR nitrogen applicator
operated in the Nitrate and CEC sensing mode. Nominal plots were
documented at 25,300 plants per acre and Increased stand plots
were documented at 28,700 plants per acre.
As shown in the Asgrow Data Chart, over all varieties, an average Population Increase
of 13.4% resulted in an average YIELD INCREASE of 13.6%,
while using Soil Doctor® technology at Sidedress. In
dramatic contrast however, in the five other tests --which used
the same seed varieties, BUT where Soil Doctor applicators
were NOT USED-- Increased plant Populations Always
Resulted in DECREASED YIELDS.
Even more remarkable however, the Soil Doctor-Treated
hybrids received an average of only 0.92 LBS N/bushel, while
the lower-yielding, Non-Soil Doctor Treated hybrids received
far more, an average of 1.42 LBS N/bushel (and up to
1.7 LBS N/BU).
Well worth noting: The Asgrow Yield data Proved that the Soil
Doctor® System provided Adequate Nitrogen supply, foot-to-foot --Even
though, on-average, significantly less fertilizer was used--
to support the Increased Populations. And the data
proved that the other nitrogen management methods --which used,
on-average, far more fertilizer-- did not. Soil Doctor®
technology enabled a significant yield increase in 24 out of the
27 different varieties tested. Including the three cases where
the yield was decreased-- the average increase in yield is
proportional to the average plant population increase.
Each of these five other tests was conducted --using all the same
hybrids-- on five other soils, within Illinois and Indiana.
Analogous to nutrient management, The Asgrow data proved that when you are farming at a
"Maxed" population, your nutrient management needs to
be far more PRECISE than the grower's typical practice to gain an
advantage from the increased plant population.
The Soil Doctor system is often used on a combine to collect soil data at the same time yield data is collected. This provides a unique, synchronized opportunity to precisely view soil and yield data together. The same management philosophy that improves corn yields does not apply to soybean yields. In corn, the highest yields occur in the heavier (highest O.M. soils), but in soybeans the opposite is true. The two maps below clearly show soybean yields are the highest in the lighter (lower CEC) soils. For these reasons, the soybean seeding strategy built-into the real-time Soil Doctor system increases population in lighter soils, decreasing seeding rates in the bottoms. (Precisely the opposite strategy is built into corn seeding rates, based on on-the-farm experience).
 |
 |
| Soybean Yield | Soil CEC |
To Industry-Unique: