- RETURN
 |
Nitrogen
Use Efficiency
In
an Illinois Corn field

|
-

- The field maps shown here summarize data
from one growing season. Data was acquired from
normal field operations for both nitrogen application and
harvest near Geneseo, Illinois.
-
- Data layers were obtained using the same
Case AFS GPS/DGPS receiver at both sidedress and harvest.
At sidedress time, Variable rate application data was
obtained from a 28% N Soil DoctorŽ-equipped 16 row
Henniker cultivator. Harvest data was obtained from an 8
row Case Combine employing the Case
AFS-derived variant of the AgLeader yield monitor.
-
- Scale yield data from the field
 were used to confirm monitor calibration.
Because data from both field operations is acquired at a
fixed sampling time (1 second GPS update interval), using
different equipment widths, data points are not at
identical spots in the field, and comparison points must
be interpolated to obtain directly
comparative locations.
-
- Examining these interpolated data layers,
in a true GIS with analytical capabilities, provided the
ability to derive commonly used data indices to assess
the efficacy of the Soil DoctorŽ system on production
practices within farm fields. All Maps herein
are Courtesy of Weber Beef, Geneseo, IL and CTI.
-
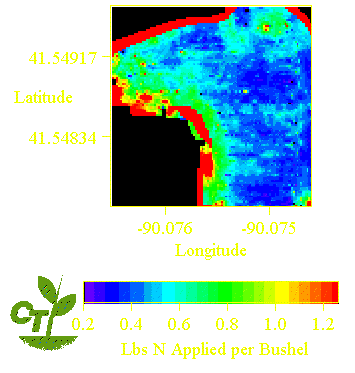
- The example to the right reveals the
efficiency ratio of LBS N applied per Bushel of corn
produced. It illustrates that the traditional view of
actually applying 1.25 LBS N/bushel of corn
yield desired is clearly not the most efficient
application method, and that the vast
majority of this field actually required less than half
that amount --in a variable rate distribution--
demonstrating the economic advantages that the Precise
Soil DoctorŽ device actually, not speculatively,
provides to its owners.
-
 The bottom line on any Precision Farming
technique is its ability to improve production economics,
although some have been trying really, really hard, for
several years, to change the subject from net profit
increases to "other benefits".
-
- And, most growers agree that if all the
effort and expense that they invest in a so-called
"precise device" doesn't result in an
improvement in their bottom line, then that technique
isn't all that precise after all.
-
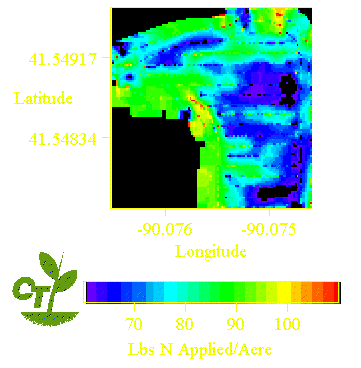
- So, let's compare the traditional N
application in this field, where 160 LBS N/acre would
have been the normal practice, to what the Soil Doctor
system variable rate applied. This map illustrates just
part of the economic advantage of the Soil DoctorŽ
system, the N Fertilizer savings. Readily visible,
Soil DoctorŽ Precision Makes its Owners More
Money.
Beyond Confirming
Soil DoctorŽ Applicator Efficacy,
Is there more that
can be learned from
The acquired data and
data analysis process?
-
- First of All, Examine your "Raw
Data" (as recorded, before analysis), before you begin your analysis operations.
-
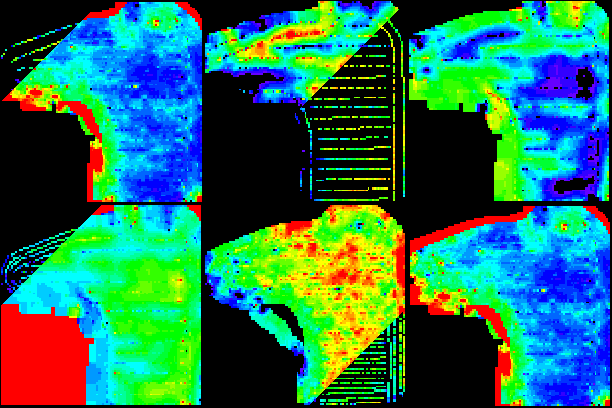
- The ground-track maps below (Application
data on the left) and (Yield Data on the right) clearly
show the difference in data layers obtained using both
the sixteen row cultivator and the eight row combine
described previously,
-
- These figures illustrate that only through
a great deal of luck could the soil, application, and
harvest data be located spatially at the same, identical
point, for layer-to-layer analysis. Consequently,
interpolation is always required for mathematical
comparisons. Unfortunately, there is no scientifically
proven interpolation methodology (not even the
much-touted kriging) that can be employed to precisely
predict values at intermediate, unsampled locations. One
is invariably required to make assumptions to extrapolate
these data, and many analysts use weighted linear
(inverse distance) interpolation.
-
- The above data were gridded, and the
originally acquired data values were retained wherever
possible . A larger interpolation smoothing interval was
required for the application data than for the combine
data due to the differences in equipment width and travel
speeds.
-
- We noted that there were yield data
that did not lie within the same field boundaries as the
application data. An unknown portion of the harvest data
set example was compromised due to seasonal GPS/DGPS
position inaccuracy near a wooded area adjacent to the
west side of the field. It is not
possible for any valid yield data to exist outside of the
field boundary sidedressed because there is forest in the
indicated location through which the combine cannot pass.
This data layer is an artifact (ERROR) associated
with the reception of the GPS/DGPS system due to the
blockage by the forest on the west side of the field.
Foliage, time of day, and the season of the year
influence the location precision obtainable from
geo-referenced location systems at this point in GPS
technology development. This distortion of true
geo-referenced field boundaries did not occur when the
field was sidedressed.
-
- Looking closer, one can also see that ground
tracks within the field shift laterally from
time-to-time. This is not a sloping field, nor was it
planted, sidedressed, or harvested, slipping on wet
soils. Rather than an indication of how well the field
was managed, the lateral shifting illustrates the
position differences resulting from computations
reflecting DGPS corrections. There are also data
drop outs, where GPS reception was temporarily
lost. Slight GPS/DGPS registration differences are
also obvious when examining the sidedress and harvest
field shapes relative to the latitude (North-South) axis.
-
Present Value of
Mapping Technology
-
- Despite many GPS/DGPS distortions, one can
construct maps today which provide a good qualitative
feel for what is going on in the field. That is the
inherent value that current mapping systems provide.
(Also see "Is Precision Farming for You?")
-
- But additional data processing must
 still be employed. Each data layer has a
time/distance distortion that must be corrected by a
specific model. In all cases, this distortion is first
removed using a simple first order lag correction. On
farm equipment, GPS receiver antennae are not located at
individual Soil DoctorŽ parameter sensor locations, but
are displaced ahead of the sensors. Combine receivers are
similarly not located at the head where the grain is
harvested.
-
- Moreover, combine yield values must also
be adjusted using a mixing transport delay model and, in
the case of the Soil DoctorŽ applicator, the flow of
nitrogen fertilizer is averaged and accumulated over a
standard 2 second interval.
-
-
-
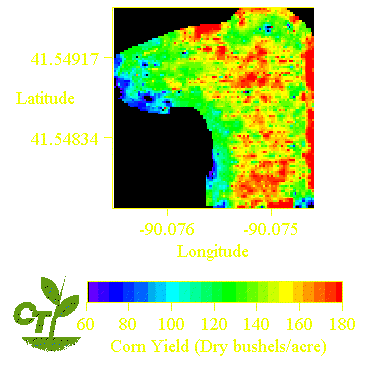
 The interpolated maps reveal that the
highest yields were obtained at
points in the field where the least N fertilizer was
applied, again confirming the efficacy of Soil
DoctorŽ Prescription Application Technology.
 -
Yes, but what
else can producers learn from these data?
* The Wide Spatial Range of Yields (over 3 to
1),
* The Marked Range of VRT Nitrogen Application
resulting in the Highest Yields where Applied N was the Least,
and
* The Depression of Yield near Field Boundaries
(foliage shading and nutrient removal) are all apparent from
these data, inviting intriguing focus for additional, but focused
on-farm studies.
- The only locations within the field where
N use levels approached standard (non-precision)
recommendations was at the field boundaries adjacent to
standing timber. Here, however, normal field yield goals
are inappropriate, because the microclimate is markedly
deliterious to reaching such goals. Not only is
photosynthesis in the corn crop inhibited due to shade,
but trees constantly extract nutrients from those soils.
Some of the highest yields were obtained at the eastern
edge of the field which has no adjacent timber.
-
- Setting aside the microclimate (the
"edge effects"), yield variations are directly
related to soil type and nutrient variations within the
field. The Soil Doctor system examines both, generating
an index which measures the nutrient potential of the
local soil before additional nitrogen is applied. When
the index is high, little nitrogen is applied, and when
the index is lower, significantly higher N levels are
applied. When mapped, the nutrient potential of the soil
is clearly seen to be directly related to the yield
patterns within the field.

Bottom Line on
State-of-the-Art Mapping
-
- In the final analysis, the resulting
accuracy of today's precision agriculture maps is
measured in tens of feet. Compare that to crop agronomic
application requirements. Agronomic requirements
are less forgiving, requiring sub-meter accuracy to
place both seed and fertilizer where they are needed from
the plants "point of view", the plant's
limited, sub-meter root system.
-
-
-
- CTI Soil Sensor Index Reveals Yield
Potential
-
- The future value of any precision
agriculture data layer is directly related to its ability
to be both descriptive and spatially explicit. As
precision agriculture systems continue to develop, data
layer co-registration accuracy remains a critical issue
that cannot always be overcome by interpolation routines
and appealing visual presentations.
-
- Today's precision agriculture data
sets do not readily lend themselves to rigorous
quantitative analysis on a true site-specific basis, but
they can be visually, qualitatively analyzed.
-
- Improvements in mapping technology will
make it easier for the producer to clearly show the
benefits that Soil DoctorŽ Right-Now technology
provides foot-to-foot, as well as the performance of
other technologies, and will aid all map-based solutions
in approaching the benefits that real-time soil sensors
have been providing producers --for over a decade.
-
- RETURN

 were used to confirm monitor calibration.
Because data from both field operations is acquired at a
fixed sampling time (1 second GPS update interval), using
different equipment widths, data points are not at
identical spots in the field, and comparison points must
be interpolated to obtain directly
comparative locations.
  The bottom line on any Precision Farming
technique is its ability to improve production economics,
although some have been trying really, really hard, for
several years, to change the subject from net profit
increases to "other benefits".
  still be employed. Each data layer has a
time/distance distortion that must be corrected by a
specific model. In all cases, this distortion is first
removed using a simple first order lag correction. On
farm equipment, GPS receiver antennae are not located at
individual Soil DoctorŽ parameter sensor locations, but
are displaced ahead of the sensors. Combine receivers are
similarly not located at the head where the grain is
harvested.
  The interpolated maps reveal that the
highest yields were obtained at
points in the field where the least N fertilizer was
applied, again confirming the efficacy of Soil
DoctorŽ Prescription Application Technology.